These are the best mobile networks in South Africa

MyBroadband Insights has published its Q2 2025 Mobile Network Quality Report, which shows that MTN has the best mobile network in South Africa.
The report is based on data was collected from crowdsourced users and extensive drive tests – both of which used the MyBroadband Speed Test platform between1 April and 30 June 2025.
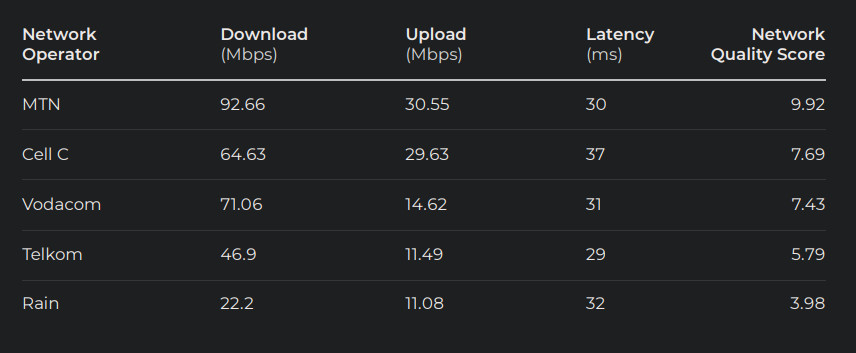
The research shows that MTN had the highest average download speed at 92.66 Mbps, up from 83.08 Mbps a year ago. The speed was also up from Q1’s result of 82.79 Mbps.
Vodacom had the second-highest download speed at 79.70 Mbps, up from 71.06 Mbps in 2024. Notably, this was up from the 61.36 Mbps recorded in Q1, where it placed third, below Cell C.
Cell C’s download speeds increased to 64.63 Mbps (up from 54.50 Mbps in Q2 2024), and Telkom improved to 46.9 Mbps from 32.29 Mbps before. Both improved on Q1 2025’s result.
Rain had the worst performance, with an average download speed of 22.2 Mbps. While this was also slightly higher than the 21.31 Mbps average in 2024, it was down from the 22.79 Mbps in Q1.
In terms of upload speeds, MTN again ranked first at 30.55 Mbps, followed by Cell C (29.63), Vodacom (14.62), Telkom (11.49) and Rain (11.08).
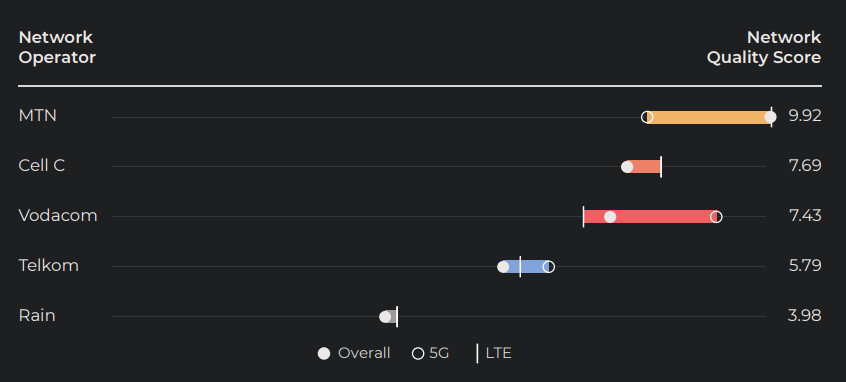
Taking latency into account and the Network Quality Score weightings, MTN emerged as the best quality network overall, with a score of 9.92 out of 10, the same as its Q1 position.
Cell C maintained its second place in the overall ranking, though its score dropped to 7.69, just edging out Vodacom, ranked third, at 7.43.
Telkom and Rain follow in fourth and last place, respectively, with scores of 5.79 and 3.98.
As was the case with the first quarter data, the consolation for Vodacom is that it still maintains the best 5G performance in the country, driven by the ongoing expansion of its 5G network.
How the scores are calculated
The data covers speedtest data across the country, with the drive testing cross all major cities, towns and main roads across 20,000km of travel.
The report comprised 304,489 speed tests from over 6,100 unique devices.
Crowdsourced data is collected from users who use various smartphones that support different technologies.
The drive tests used smartphones that support the latest technologies, as well as mid range smartphones that replicate the experience of most users.
Because of this, the data presents the real-world performance of mobile network operators.
To caluclate the network quality scores, MyBroadband Insights weights the download speed (60%), upload speed (20%), and latency (20%) for each operator.
The network score is a value which shows the relative performance of each network, with a maximum score of 10.
To ensure accurate results, unnatural results are filtered out, and cell down-sampling is used.
The average network performance for LTE and 5G is calculated separately, and combined in an overall score for each operator weighted based on the sample distribution between the technologies.